The importance of knowing the glass transition temperature

The importance of knowing the glass transition temperature and its measurement methods in polymer products
Introduction
The glass transition temperature is the temperature at which the material changes from a solid state to a rubbery state. The difference between this temperature and the melting temperature is that at the melting temperature, the state of matter changes from solid to liquid. The importance of knowing the glass transition temperature is in changing the mechanical properties of the material at this temperature, which may not meet the consumer’s expectations.
The glass transition temperature is usually defined for amorphous (disordered) and semi-crystalline polymers, and the more crystalline the polymer or the more ordered, this temperature increases. Figure 1 shows the amorphous and crystal regions in a polymer. If a polymer is completely amorphous, there will be no melting temperature in it, but because all polymers have amorphous regions, although very small; In this case, it will definitely have a glass transition temperature. In Figure 2, the difference between melting temperature and glass transition temperature in a polymer can be seen.
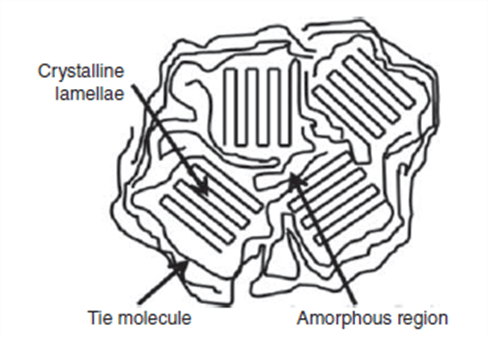 Fig 1. Amorphous and crystalline regions in a polymer
As mentioned, the glass transition temperature is one of the most important physical properties of polymers. Since the behavior of a polymer above or below this point is very different, the properties affecting this temperature and how to obtain this point are of great importance. Therefore, in the following, the factors affecting this temperature and measurement methods have been discussed.
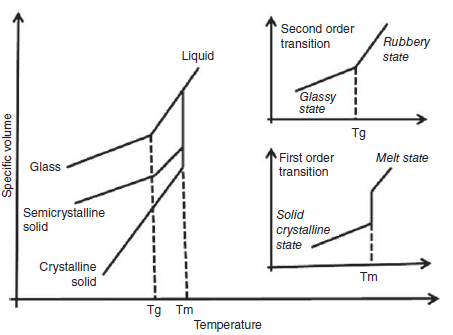 Fig 2. The difference between glass and melt temperatures
Factors affecting glass temperature
The glass transition temperature depends on the mobility and flexibility of the polymer chain (the ease of the chain segment to rotate along the main chain). If the polymer chain can move easily, the glassy state can change to the rubbery state. Now, if for any reason the rotation of the chains encounters resistance; To exit the glass state, more temperature will be needed and the glass temperature will increase.
Now let’s examine some parameters affecting this temperature:
-
Intermolecular forces
Strong intermolecular forces increase the glass transition temperature. For example, the glass transition temperature in PVC material (Tg=80 ℃) is much higher due to the stronger intermolecular force compared to polypropylene, which has a glass transition temperature (Tg=-180 ℃). The reason why the intermolecular bonding of PVC is strong is the existence of the C-Cl dipole-dipole bond.
-
Main chain stiffness
The presence of heavy groups in terms of molecular weight in the main chain increases the glass transition point; Because it reduces the flexibility of the chain. For example, polyethylene terephthalate (Tg=69 ℃) has a higher glass transition temperature than polyethylene adipate (Tg=-70 ℃) due to its benzene ring.
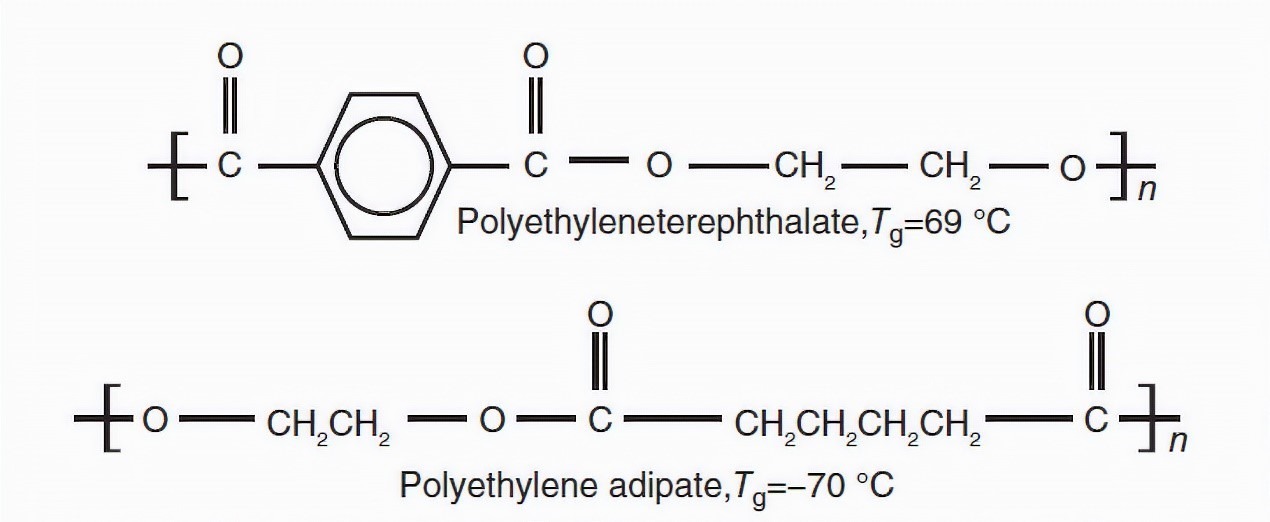 Fig 3. Effect of benzene ring on Tg
-
Crosslinking
Cross-linking between chains restricts movement and rotation; Therefore, the glass transition temperature increases. Hence, cross-linked polymers have a higher glass transition point. For example, the glass transition temperature of cross-linked HDPE, in its maximum state, is 125 °C, which is very close to the melting temperature of this polymer in its raw state. However, without cross-linking, this temperature reaches -90 degrees Celsius.
 Fig 4. Crosslinking
-
The group attached to the main chain
The groups attached to the main chain, depending on their nature, can lower or increase the glass transition temperature. The effect of these groups can be analyzed in two general categories.
Bulk connecting group: The presence of a bulk group in the main chain, such as a benzene ring, can make it difficult for the main chain to rotate and lead to an increase in the glass transition temperature.
 Fig 5. Effect of a bulk group on Tg
Flexible connecting group: The presence of a flexible group in the main chain, such as an aliphatic chain causes the main chain to move more easily; Because it adds space for the rotation of the chain. In this case, the glass transition temperature decreases.
 Fig 6. Effect of a flexible group on Tg
-
Plasticizers
Plasticizers are non-volatile and have a low molecular weight that are used to increase the effectiveness of chains and are widely used to reduce costs. Plasticizers reduce the adhesion of polymer chains; For this reason, they reduce the glass transition temperature. For example, DOP plasticizer is used for vinyl chloride polymer (Figure 7).
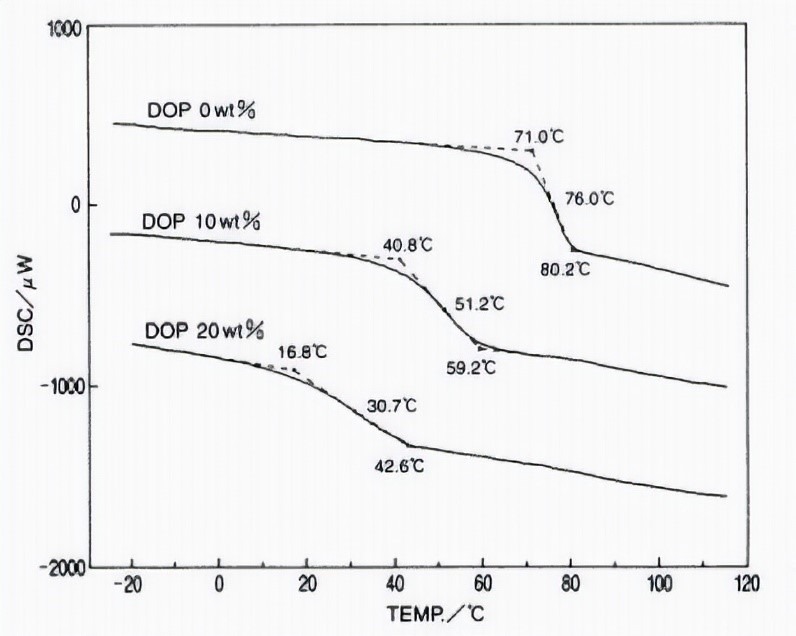 Fig 7. Reducing the glass transition zone by increasing the plasticizer
As it can be seen in figure 7, with adding the plasticizer to 10% wt, Tg climbed from 71 to 40.8 ℃ and with increasing amount of plasticizer to 20% wt, Tg reached 16.8℃.
-
Molecular weight
The molecular weight increases the glass transition temperature due to increasing the stiffness in the movement and rotation of the polymer chains. As seen in Figure 8, with the increase in the molecular weight of the polymer up to 20,000, the glass transition temperature has also increased; But after that, increasing the molecular weight does not have a significant effect on this temperature.
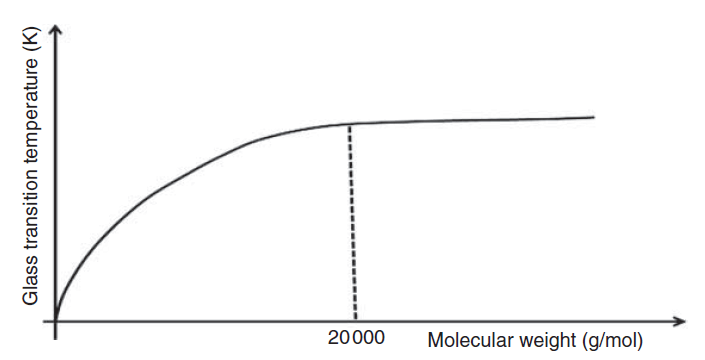 Fig 8. Effect of molecular weight on Tg
Methods of measuring Tg
Measurement methods are important because they are tied to different chemical and physical properties. For example, as the temperature increases and reaches the glass transition region, the mechanical properties, including the Young’s modulus, start to decrease abruptly; which represents the glass transition region. Therefore, by using the change of these properties in a jump form, it is possible to determine the glass transition temperature. In this section, some conventional methods of measuring this temperature will be introduced.
-
Thermodynamic Analysis (TMA)
In the thermodynamic analysis method, a small sample of the desired polymer is used. A rod is placed on the sample with a small force and the sample itself is placed on a surface in an oil bath. After that, the heating of the oil bath is started and the amount of changes in the length of the rod connected to the sample is measured by the LVDT linear variable transformer device. The temperature of the oil bath typically increases by 5°C per minute. In this case, the slope of the graph of length changes in terms of temperature indicates the coefficient of thermal expansion. Any temperature at which the slope of the line or the coefficient of thermal expansion changes, is called the glass transition zone.
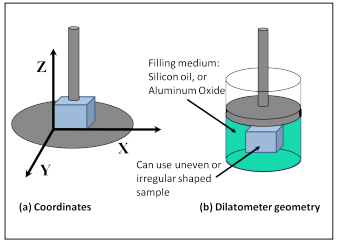 Fig 9. TMA device
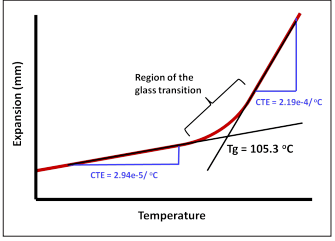 Fig 10. Tg zone in TMA test method
-
Differential Scanning Calorimetry (DSC)
In this method, a small sample of polymer is prepared and heat is given to it. Meanwhile, the amount of energy required to heat the sample is measured. Since the physical properties change in the glass transition region, the energy required to heat the sample also changes. This is shown as a bend in the diagram.
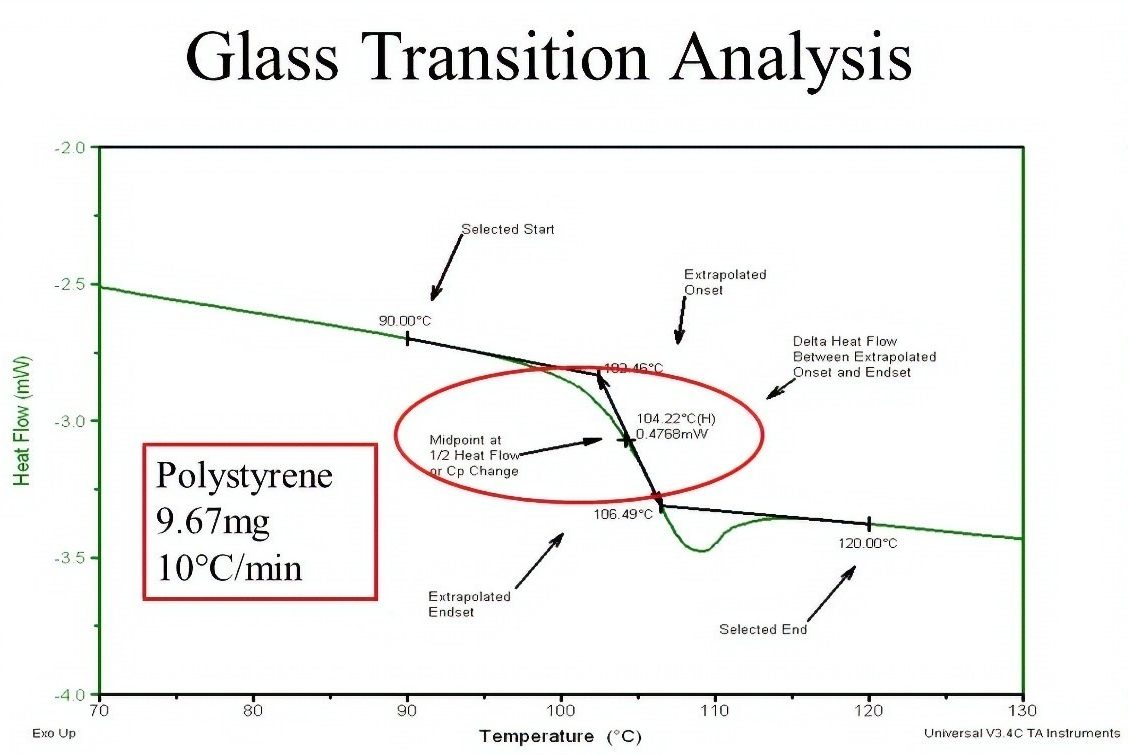 Fig 11. Determining Tg by DSC test method
-
Dynamic Mechanical Analysis (DMA)
The basis for measuring the glass transition temperature in this method is the measurement of mechanical properties. At first, a sample of prepared polymer is putted under a frequency of 1 Hz and a heating rate of 5 °C/min. Then, storage modulus, loss modulus and heating coefficient are measured in terms of temperature in a graph. As the temperature increases, the mechanical properties deteriorate until it reaches a specific transition region, and the beginning of that region is known as the glass transition temperature (in the red area of Figure 12).
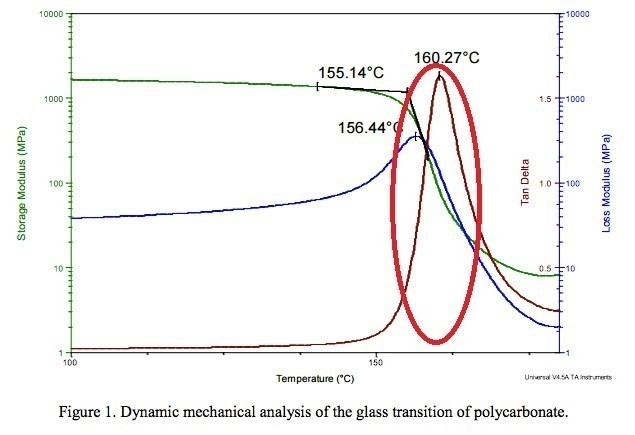 Fig 12. A DMA test for poly carbonate
Conclusion
In this article, the definition of glass transition temperature, factors affecting it, and measurement methods were discussed. At this temperature, the mechanical and chemical properties of the material change, and it is possible to predict these properties by knowing the glass transition temperature. However, sometimes the conditions are such that the use of a certain polymer at a certain temperature is unavoidable. That is why, how to change the glass transition temperature and the effect of changing this temperature on other properties of the material is one of the topics studied by researchers today.
At the end, the glass transition temperature of some commonly used polymer materials is given as examples.
Table 1. glass transition temperature of some polymers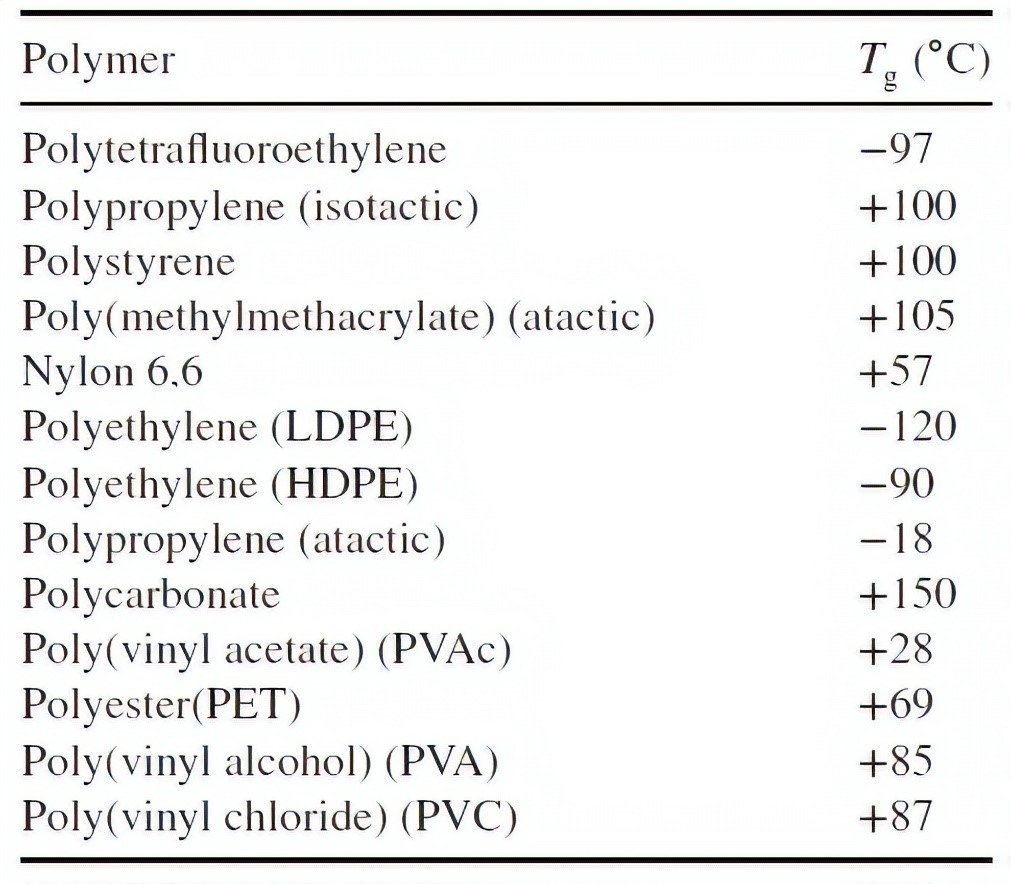
References
1-A Materials Science and Engineering Perspective, First Edition.Edited by Kantesh Balani, Vivek Verma, Arvind Agarwal, Roger Narayan.
2-The glass transition temperature Tg of polymers—Comparison of the values from differential thermal analysis (DTA, DSC) and dynamic mechanical measurements (torsion pendulum)
3-glass transitions in polymers M. S. Shen and A. Eisenberg
Author: Emad Izadi Vasafi


